


More often than it meaningfully changes.
There is no industry standard that says twice a shift, every 30 minutes or every 4 seconds. The right interval depends on how fast your material moves. This article explains how to find that rate for your own process, when a periodic manual check is enough, and how to make each manual reading count.
That answer is unsatisfying because it means the number is different for every plant. It is still an answerable question. You just have to answer it for your process, not for coatings in general.
Why There Is No Single Number
Viscosity does not sit still. Temperature is the main thing moving it, and how fast it moves depends on conditions specific to your line.
How much a degree matters depends on the material. On one line running a white with a heavy titanium dioxide load, a three-quarter degree drop raised viscosity 4.75 cP, about 6% of the total per degree Fahrenheit [3]. On an automotive clearcoat line, a 13°F swing moved viscosity about 8 cup seconds, roughly one second for every one and a half degrees, against an average of 26 to 28 seconds [1].
The rate of change comes from four sources:
- Ambient swing. Even a climate-controlled plant drifts several degrees between the start of first shift and the middle of second, and seasonally. Uncontrolled space swings much more, and it swings differently in July than in January.
- Shear and friction. Recirculating material picks up heat from pumps and back pressure regulators. On a roll coater, friction at the nip can drive coating temperature up around ten degrees an hour while ambient moves five [7]. That heat comes from your process, so it does not care what the HVAC is doing.
- Solvent loss. Open systems flash solvent all day. Viscosity climbs as solids concentrate while a warming plant pushes viscosity down, so the two can mask each other. The reading looks stable while the material underneath it is not.
- Events. Drum changes, batch changes, paint adds, filter swaps, purges, line stops and restarts. Each one is a step change rather than a drift, and each one takes time to settle.
Two plants running the same coating can have completely different rates of change depending on which of these dominate. That is why the answer has to come from your process.
The Same Shift, Sampled at Nine Different Rates
One way to see the effect of sampling rate is to take a continuous record and thin it out. The rows below come from continuous readings logged every 4 seconds by an inline viscometer on an automotive clearcoat line, then re-sampled at slower intervals to show what each schedule would have caught [1]. An automotive OEM paint line showed the same progression [2].
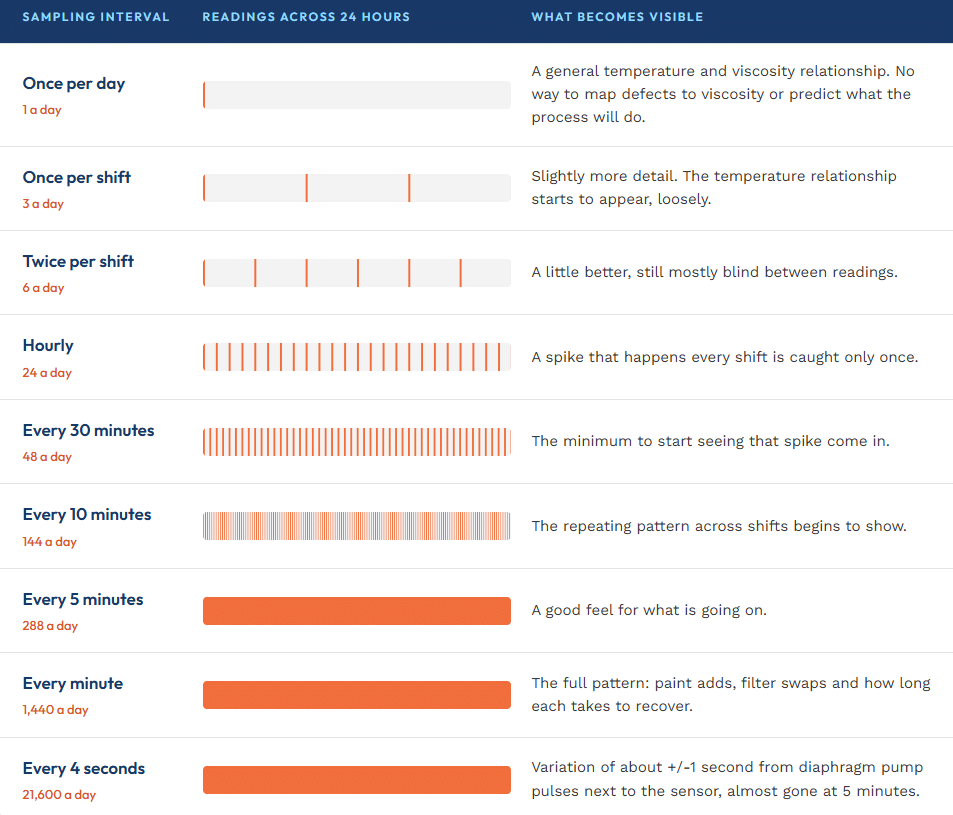
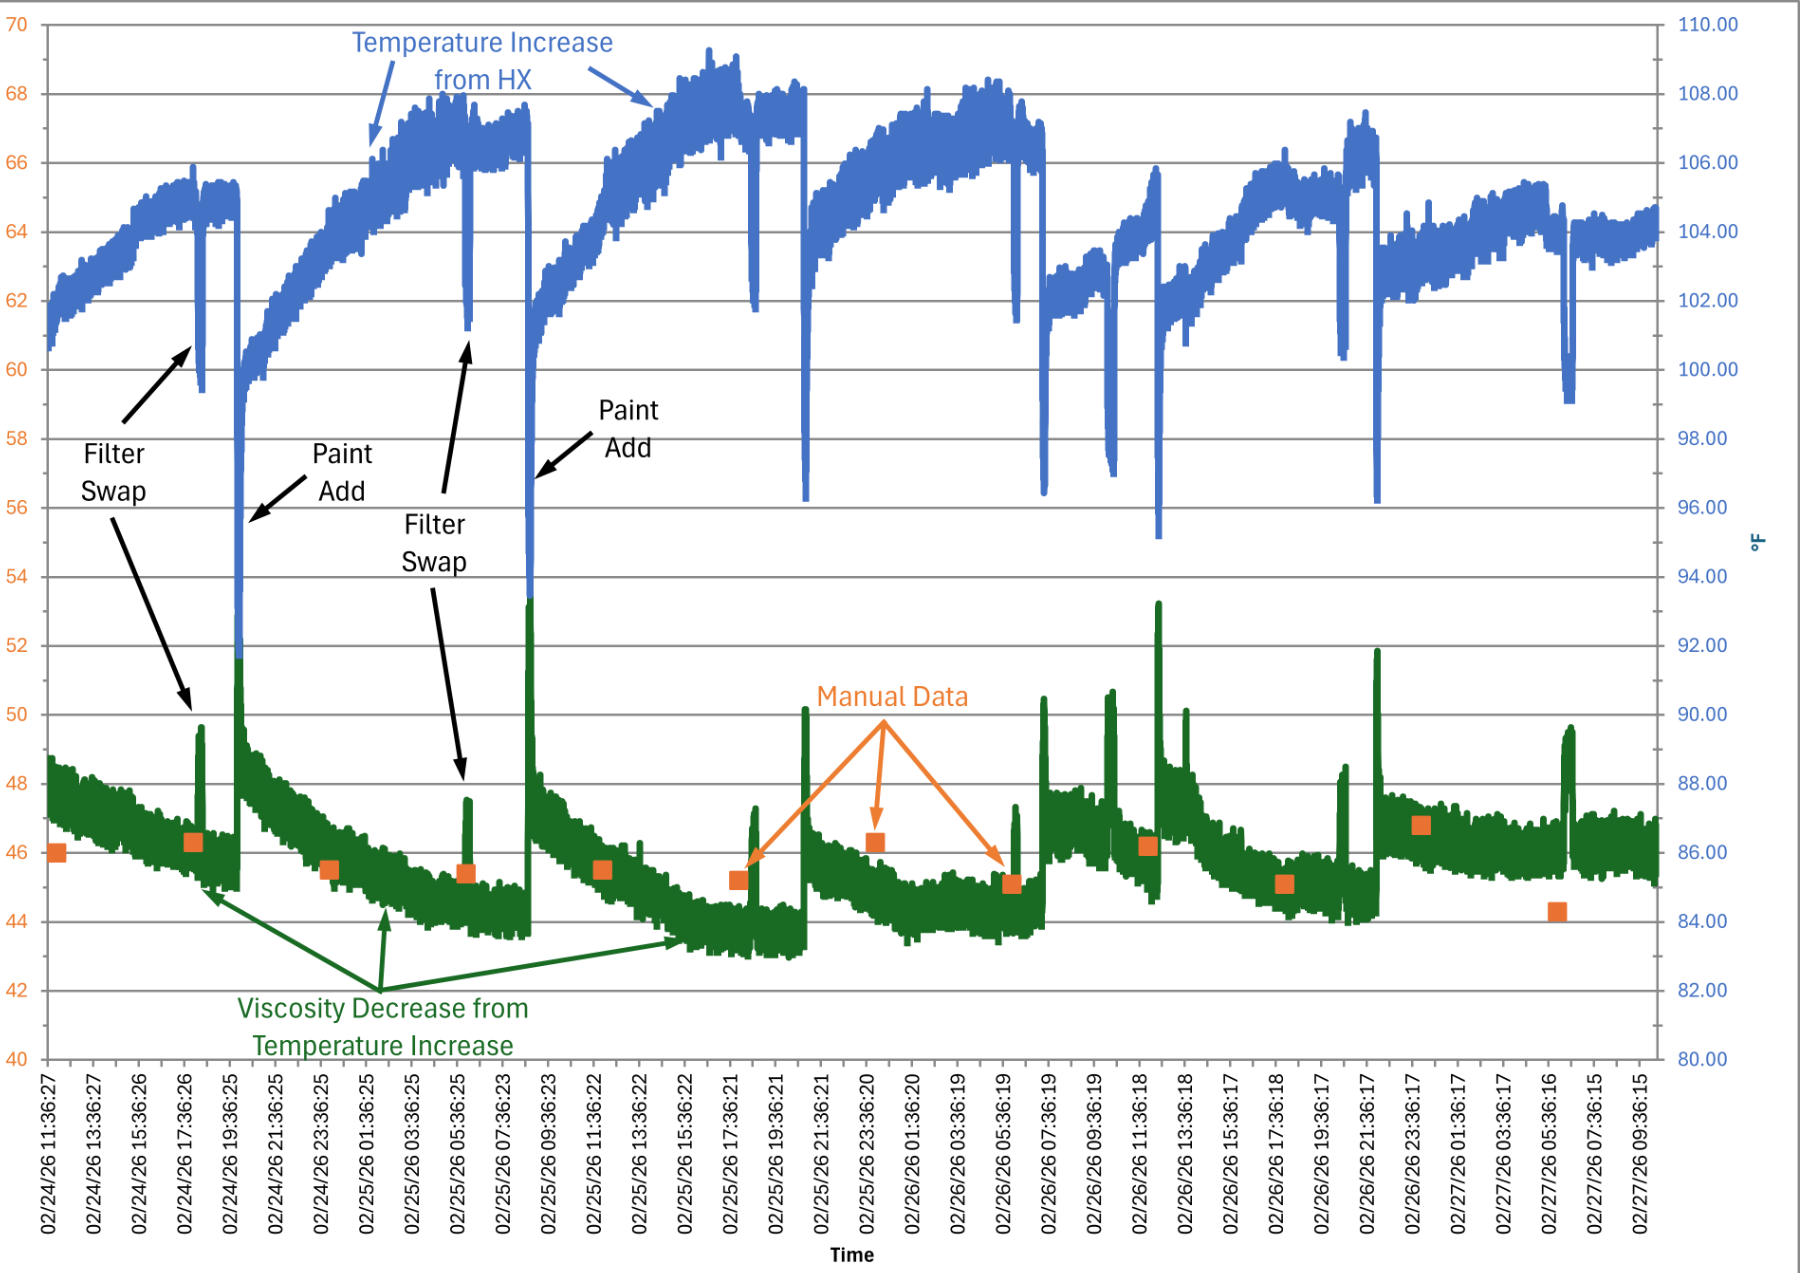
The events the slow schedules miss are ordinary ones. At an automotive OEM, an inline viscometer was added to a paint line that had relied on periodic manual checks. Continuous inline monitoring showed that makeup paint added at the end of each shift came out of the tote colder than the day tank. The tank temperature dropped, viscosity rose, and then viscosity fell steadily for the rest of the shift as the system warmed. Parts were being painted the whole time [2].
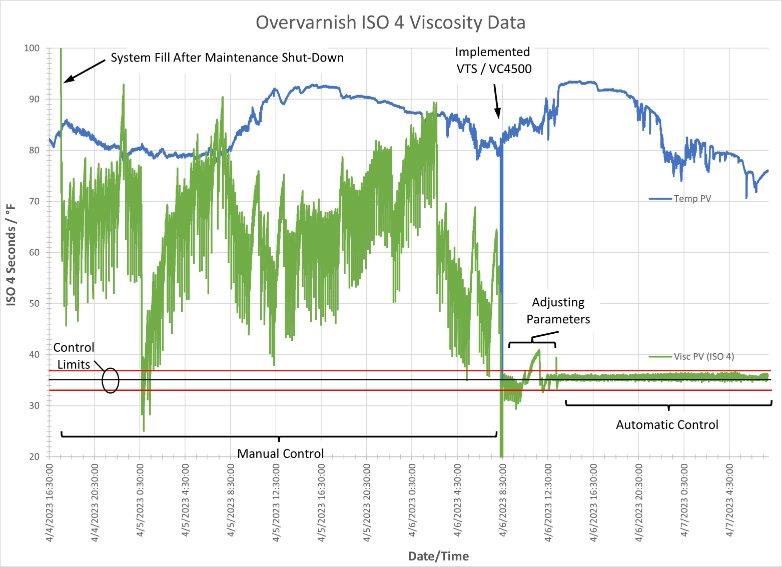
Plants measuring once a day are not unusual. At one line where operators checked viscosity about once a day, the engineer reviewing the first continuous record said they were seeing more than they had ever expected to see [3]. A can manufacturer applying an overvarnish checked viscosity with a cup roughly every two hours and added solvent by hand based on each reading. Between those checks, viscosity swung well outside its control limits, and none of that movement appeared in the log [4].
How to Find Your Number
Measure frequently for a few days and look at the shape. Take readings every 15 or 30 minutes for two or three shifts, across different times of day, and plot them. Include a hot afternoon and a cold morning if you can.
You are looking for how long it takes your viscosity to move enough to matter. If it takes four hours to move a full second, checking every two hours is defensible. If it moves a few cup seconds in twenty minutes during a drum change and takes an hour to settle, checking twice a shift means you are certain to miss it.
The rule underneath this is simple. Measure something slower than it changes and you do not get a rough picture of it. You get a wrong one. Two readings eight hours apart cannot describe something that moves over the course of an hour, no matter how accurate each reading is.
The test. Compare each reading to the one before it. If they are usually close, your schedule is keeping up. If they often jump, viscosity is moving between your checks and you need to measure more often.
When Twice a Shift Is Enough, and When It Is Not
Sometimes a periodic manual check is a reasonable control and you should keep doing what you are doing. Adding measurement to a process that is not varying gets you a more detailed picture of nothing happening.
Manual checks are probably adequate if most of these are true
- Your material sits in a conditioned space and ambient is stable within a couple of degrees
- Your coating is not especially temperature sensitive
- Your finish tolerance is wide enough that a second or two of viscosity does not show up on the part
- Your runs are short, so you change over before drift accumulates
- You are not fighting defects, and when you get one you can usually explain it with another variable
If that is your shop, periodic checks are fine.
Periodic checks will likely miss things if these are true
- Wide ambient swing, daily or seasonal
- Long runs, where drift has hours to accumulate
- High-shear systems: recirculation loops, roll coaters
- Tight finish specs, especially where appearance is the product
- Materials with steep temperature sensitivity. UV and EB coatings are roughly ten times more viscosity sensitive to temperature than a typical solventborne [7]
- 2K, where you are matching two materials and managing pot life
- Defects that come and go without an explanation, or a rework rate that is quietly worse in summer or winter
The last item is the tell. If your process produces problems you cannot trace to a change you made, the change may have happened to your material rather than to your settings, and you do not have the resolution to see it.
How to Take a Good Manual Reading
If you rely on a manual check, it is worth doing properly. A lot of the variation people blame on their material is variation in how the measurement was taken.
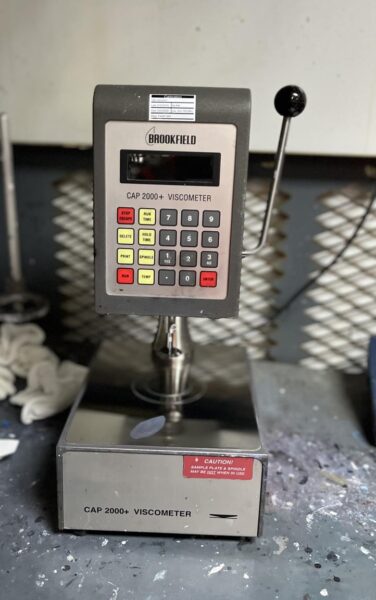
A bench viscometer such as a Brookfield cone-and-plate removes much of the guesswork of a cup, but it is still a manual method with limits. One coatings quality engineer ran a gauge R&R on a clearcoat held to a 4 second spec width, comparing a cone-and-plate meter against a cup with three people across several days. Converted to cup seconds, both methods needed a 12 second spec width to be capable. The cup became strongly nonlinear at low viscosity, about three times worse than the cone-and-plate [5]. Whatever instrument you use, these habits remove most of the avoidable error:
- Sample from a representative point. The material in the mix room is not the material at the applicator. If you are trying to control what the gun sprays, sample as close to it as you can. Sampling somewhere convenient rather than somewhere representative is the most common problem.
- Make sure it is agitated. A sample pulled from a still tank is not the material that is circulating. Pigment settles, and the top of a drum is not the bottom of a drum.
- Set and record the test temperature. A viscosity number without a temperature is close to meaningless. Let the plate reach the set temperature and give the sample time to equilibrate before you read it. If you write down 45 cP and nothing else, you cannot compare it to yesterday’s 45 cP.
- Use the same cone or spindle and speed every time. Viscosity readings depend on the shear rate, and the shear rate depends on the cone or spindle and the speed. Change either and you have a different measurement. Write the method down and confirm which one you are using before comparing readings, the same way one can manufacturer found a single line using a different cup from the other three [4].
- Keep the cone and plate clean. Dried or cured material on the cone or plate changes the gap and the reading. Clean both properly between samples, not only when they look dirty.
- Keep calibration current. Check the instrument against a viscosity standard on a schedule and keep the calibration label up to date. A drifting instrument produces confident, wrong numbers.
- Be consistent on run time and handling. Load the same sample volume and read at the same point in the run. Different operators handle samples differently; with cups, half a second to a full second between people is common [6]. Agree on the technique and train to it.
- Record it somewhere you can plot. A number on a clipboard that gets filed is a compliance record. A number in a spreadsheet you can graph is data. Most of the value is in the shape over time, not in any single reading.
Do those things and your manual readings become comparable from one shift and one operator to the next. Even a perfect manual reading, though, only tells you what the material was doing at the moment you sampled it.
From a Snapshot to Seeing the Process
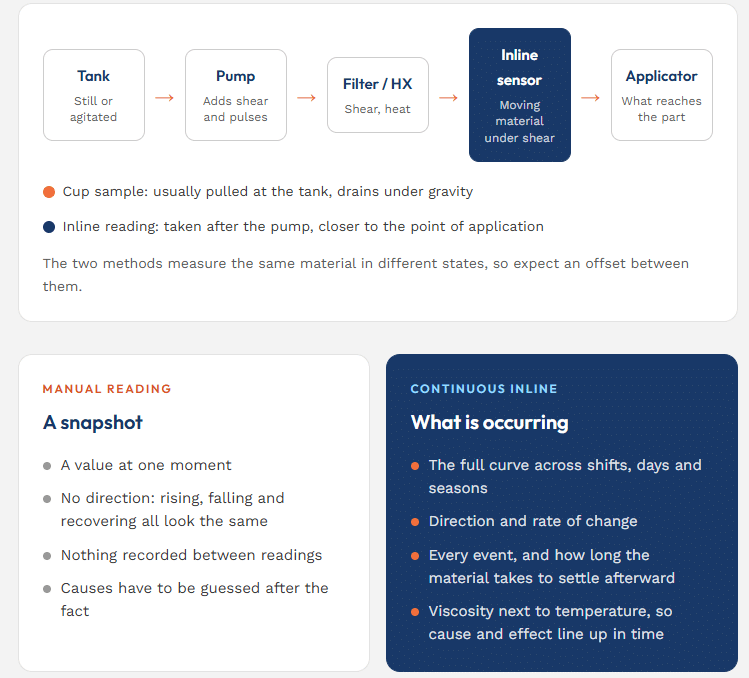
A manual reading is a snapshot. It tells you what one sample was doing at one moment, measured one way. It cannot tell you where viscosity was heading, how far it went before the next check, or what made it move.
Continuous inline monitoring with a viscometer records the process as it happens. Instead of isolated points, you see the movement itself, alongside everything else going on at the line. Because the viscometer sits in the circulating line, it also reads the material on its way to the applicator rather than a sample pulled from the tank.
What the snapshots were hiding
Plants are often confident they are holding a tight range, because every reading they take lands inside it. In one trial an inline viscometer was installed in read-only mode while operators kept adjusting by hand. It showed how far outside the range viscosity actually went between checks [9]. At another plant the log said a zone ran at 13 seconds all the time. Nobody knew what the viscosity did between those checks, because no one was measuring it [8].
“I like to know what viscosity I’m at. I don’t like flying blind.”
Process engineer, coil coating line [10]
Seeing events in context
A single high reading raises a question a snapshot cannot answer: is the material off, is it cold, or was a tote just added? Continuous inline monitoring answers it. On the automotive clearcoat line in the three-day chart earlier in this article, inline readings logged every 4 seconds showed each paint add drop the temperature and spike viscosity, followed by hours of steady decline as the system warmed back up [1]. When viscosity was only measured once a shift, that decline went undetected, and the line spent hours running outside where it was set without anyone knowing.
A manual check tells you whether one reading is in spec. Continuous inline monitoring tells you why viscosity moves, when it moves and how long it takes to recover. You can see how long a drum change takes to settle, how the plant’s temperature affects your material from shift to shift, and whether a process you believed was stable really is.
Start by watching
The most useful first step is to run an inline viscometer in monitor-only mode alongside your existing manual checks and compare the two. Plants that have done this describe the same moment: the data goes up on a screen and the variation they had been working around becomes visible for the first time [8].
Control is a separate, later decision. Once you understand your pattern, the same readings can be used to correct it by adjusting temperature or dosing solvent, without waiting for the next manual check. The chart below shows what that step looked like on one line.
The Short Version
Measure more often than your material meaningfully changes.
You find that rate by measuring frequently for a few days and looking at the shape, not by adopting somebody else’s schedule. If your process is stable and your tolerance is wide, twice a shift may be exactly right. If it is not, no amount of accuracy in an individual reading will make up for not being there when it moves.
The manual check is not the problem. The problem is what you miss when your material changes faster than you measure it.
Sources
[1] Recorded engineering review of inline viscosity and temperature data logged every 4 seconds on an automotive clearcoat line, July 2026. Cup type not stated in the recording.
[2] Recorded engineering review of inline data from an automotive OEM paint line, August 2026.
[3] Recorded data review with a coating line running a high titanium dioxide white, April 2026.
[4] Recorded technical discussion with a can manufacturer, April 2025.
[5] Recorded conversation with a coatings quality engineer describing a cup and cone-and-plate gauge R&R on an automotive clearcoat, May 2026. The specific cone-and-plate instrument was not named.
[6] Recorded inline viscosity trial setup call with field service engineers, October 2025.
[7] Internal draft, “How often should you measure viscosity,” September 2026. Underlying measurement not yet sourced.
[8] Recorded introductory call with an industrial equipment partner, February 2025.
[9] Recorded technical discussion with a label materials manufacturer, January 2025.
[10] Recorded discovery call with a coil coating process engineer, February 2025.
Helpful Links & Resources